Customer engagement doesn’t happen in one place. It shows up in purchases, website visits, email clicks, loyalty programme activity and customer feedback, often all at once.
That’s why a single metric rarely tells the full story. A strong email click-through rate looks great on a dashboard, but it doesn’t confirm that customers are buying more or staying longer. Effective measurement connects three things: what customers do, how they feel, and what happens to the relationship over time.
To measure customer engagement well, look at three layers: engagement activity, customer behaviour and business outcomes. This guide walks through each one, the 12 metrics that matter most, and how to choose the right ones for your goals.
What Is Customer Engagement?
Customer engagement describes how actively customers interact with your brand and take part in the relationship. It covers every meaningful action, from browsing and buying to joining a loyalty programme, redeeming a reward or leaving a review.
Engaged customers don’t just transact. They return, respond and participate.
Customer engagement vs customer experience vs customer satisfaction
These terms often get used interchangeably, but each measures something different:
- Customer experience is the overall perception customers form across every interaction with your brand.
- Customer satisfaction is how satisfied customers are with a specific interaction or experience, such as a purchase or a support call.
- Customer engagement is how actively customers interact with and participate in the relationship.
A customer can be satisfied without being engaged. They liked their last purchase, but they haven’t returned since. Measuring engagement helps you see that gap, and act on it.
Why Measure Customer Engagement?
Understand how customers interact with your brand
Which channels spark real interaction? Which campaigns, products or experiences get customers to act? Measuring engagement shows you where your effort is paying off and where it’s simply adding noise.
That clarity matters when budgets are tight. If a points campaign drives twice the participation of a newsletter promotion, you know where your next dollar should go.
Identify disengagement early
Customers rarely leave overnight. Purchase frequency drops, activity slows and participation fades. Tracking engagement gives you a chance to spot those signals and respond before a quiet customer becomes a lost one. A timely, relevant reward usually costs less than winning that customer back later.
Connect engagement to retention and revenue
This is where measurement moves beyond vanity metrics. The important question isn’t simply, “Are customers engaging?” It’s, “Is customer engagement contributing to stronger relationships and business outcomes?”
Because customer engagement is needed to build customer loyalty.
12 Customer Engagement Metrics to Measure
Rather than treating these as one long list, it helps to group them by what they reveal.
A. Engagement and interaction metrics
- Customer engagement rate
This measures the proportion of customers who take a defined engagement action.
Engagement rate = Engaged customers ÷ Total customers × 100
There’s no universal formula because “engaged” depends on your programme or campaign. It might mean clicking, purchasing, completing an activity or redeeming a reward. Define it clearly upfront, then keep that definition consistent so results stay comparable.
- Purchase frequency
This shows how often customers buy within a set period.
Purchase frequency = Number of purchases ÷ Number of unique customers
Frequency is especially useful for loyalty and retention. A customer who buys monthly has a habit with your brand. When that rhythm slows, it’s often an early sign that something has changed.
- Repeat purchase rate
This measures the percentage of customers who come back to buy again.
Repeat purchase rate = Customers who made more than one purchase ÷ Total customers × 100
For businesses running reward programmes, this metric matters. Rewards are often designed to bring customers back, so repeat purchase rate shows whether that’s actually happening.
- Reward programme participation rate
This tracks how many eligible customers actively take part in your reward or loyalty programme.
Participation rate = Active programme participants ÷ Eligible customers × 100
Define “active” by a clear action, such as earning points, completing an activity or redeeming a reward. Sign-ups alone can overstate how engaged your members really are.
- Reward redemption rate
This shows how many customers who earn rewards go on to use them.
Redemption rate = Customers who redeem rewards ÷ Customers who earn rewards × 100
A low rate isn’t just a number. It can tell you whether rewards are appealing, whether customers understand how to redeem them, and whether there’s friction in the journey. It also reveals which rewards and campaigns generate the most activity. Smooth, instant digital redemption often makes a noticeable difference here.
B. Customer sentiment and relationship metrics
- Net Promoter Score (NPS)
NPS measures how likely customers are to recommend your brand, on a scale of 0 to 10. Subtract the percentage of detractors (0 to 6) from the percentage of promoters (9 to 10).
It works well for tracking overall relationship health, quarterly or after key milestones. Just don’t view it in isolation. A strong NPS alongside falling purchase frequency deserves a closer look.
- Customer Satisfaction Score (CSAT)
CSAT captures how satisfied customers are with a specific touchpoint, such as a purchase, a service interaction, a campaign or a reward redemption.
Here’s a practical example. After a customer redeems a reward, ask them to rate how satisfied they were with the experience. Over time, you’ll see which rewards delight customers and which fall flat.
- Customer Effort Score (CES)
CES measures how easy or difficult it was for customers to complete an action. Ask something simple: “How easy was it to redeem your reward?”
For reward programmes, this is particularly valuable. Redemption friction is something you can measure, fix and improve. When effort goes down, participation often goes up.
C. Business outcome metrics
- Customer retention rate
Retention rate = (Customers at end of period ? New customers acquired) ÷ Customers at start of period × 100
Retention gives your engagement metrics context. High activity means little if customers still leave. Rising retention alongside rising engagement is a far stronger signal.
- Customer churn rate
Churn rate = Customers lost during a period ÷ Customers at the beginning of the period × 100
Engagement metrics can help you spot behavioural change before churn shows up. A typical pattern might look like this: declining purchase frequency, then fewer programme interactions, then lower reward redemption, then churn.
Treat this as a framework for analysing behaviour, not a guarantee. No single metric automatically predicts churn, but patterns across several are worth watching.
Also read: Churn Rate Analysis: How to Identify At-Risk Customers and Improve Retention
- Customer Lifetime Value (CLV)
Engagement should ultimately contribute to long-term customer value. Yet customers who interact often aren’t always the most valuable ones. Segmenting CLV shows which groups are worth retaining and nurturing.
One useful comparison is CLV for loyalty programme members versus non-members. Be careful with interpretation, though. A difference doesn’t prove the programme caused it unless you have experimental or causal evidence.
Also read: Customer Lifetime Value: Formula & 12 Ways to Increase It
- Average Order Value (AOV)
AOV = Total revenue ÷ Number of orders
AOV adds depth to engagement data. Are highly engaged customers spending more per transaction? Does a particular reward campaign influence basket size? Or is engagement increasing frequency without lifting order value? Each answer points to a different next step.
How to Choose the Right Customer Engagement Metrics
Tracking all 12 metrics at once rarely helps. Instead, match your metrics to the objective you care about most.
| Business objective | Metrics to consider |
| Increase customer interaction | Engagement rate, programme participation |
| Encourage repeat purchases | Purchase frequency, repeat purchase rate |
| Improve loyalty programme performance | Participation rate, redemption rate |
| Improve customer experience | CSAT, CES, NPS |
| Increase retention | Retention rate, churn rate |
| Increase customer value | CLV, AOV |
Don’t try to optimise every metric at once. Start with the business outcome you want to influence, then identify the engagement behaviours that support it.
Picture a retail brand whose goal is to lift repeat purchases. Its team doesn’t need to obsess over NPS every week. It needs to watch purchase frequency, repeat purchase rate and how often members redeem rewards that bring them back. Fewer metrics, tracked well, usually lead to clearer decisions.
How to Measure Customer Engagement Step by Step
Step 1. Define your customer engagement goal
Start with a clear objective. That could be increasing repeat purchases, improving loyalty programme participation, lifting reward redemption, improving retention or growing customer lifetime value. Pick one primary goal first. It keeps reporting focused and makes trade-offs easier to discuss with stakeholders.
Step 2. Define what counts as engagement
Decide which actions matter for your goal. Common examples include purchases, logins, website interactions, email clicks, programme participation, points earned, reward redemptions, referrals and survey responses.
Step 3. Choose a combination of leading and outcome metrics
Leading metrics show behaviour as it happens. Outcome metrics confirm whether it’s working. Say your goal is to increase repeat purchases:
- Leading metrics: programme participation, reward redemption, purchase frequency
- Outcome metrics: repeat purchase rate, retention rate, CLV
Step 4. Segment your customer data
Averages hide useful detail. Break your metrics down by new vs existing customers, customer value, lifecycle stage, product or service, geography, loyalty programme participation, campaign and reward type.
Step 5. Track changes over time
A single month’s engagement rate tells you relatively little. Seasonality, promotions and one-off events can all skew a snapshot. Look at month-over-month and quarter-over-quarter trends, cohort behaviour, pre- and post-campaign results, and programme members versus non-members.
Step 6. Connect engagement metrics to business outcomes
The goal isn’t simply to report that customers are engaging. It’s to understand whether that engagement is contributing to the outcomes your business cares about, such as retention, revenue and long-term value.
How Rewards Can Help Increase and Measure Customer Engagement
Rewards do more than motivate. They turn engagement into clear, trackable actions. When a customer earns points or redeems a reward, you get a measurable signal tied to a specific objective.
| Engagement objective | Reward mechanism | Metric |
| Encourage repeat purchases | Points for repeat purchases | Purchase frequency |
| Increase programme participation | Sign-up reward | Participation rate |
| Encourage specific behaviours | Points for defined actions | Activity completion |
| Drive redemption | Flexible reward catalogue | Redemption rate |
| Encourage referrals | Referral rewards | Referral rate |
| Re-engage inactive customers | Targeted reward | Reactivation rate |
The real value is in the connection between mechanism and metric. If a sign-up reward boosts participation but redemption stays low, you know where to look next. If a reactivation offer brings inactive customers back once but not twice, that’s useful too.
Setting this up manually can be complex, especially across teams and markets. A platform such as SPUR supports it by letting businesses create reward flows, segment audiences, distribute points and rewards, and track campaign performance in one place.
Also read: The Power of Gamification Marketing: Research-Backed Benefits and Real Examples
How SPUR Helps Businesses Measure Customer Engagement
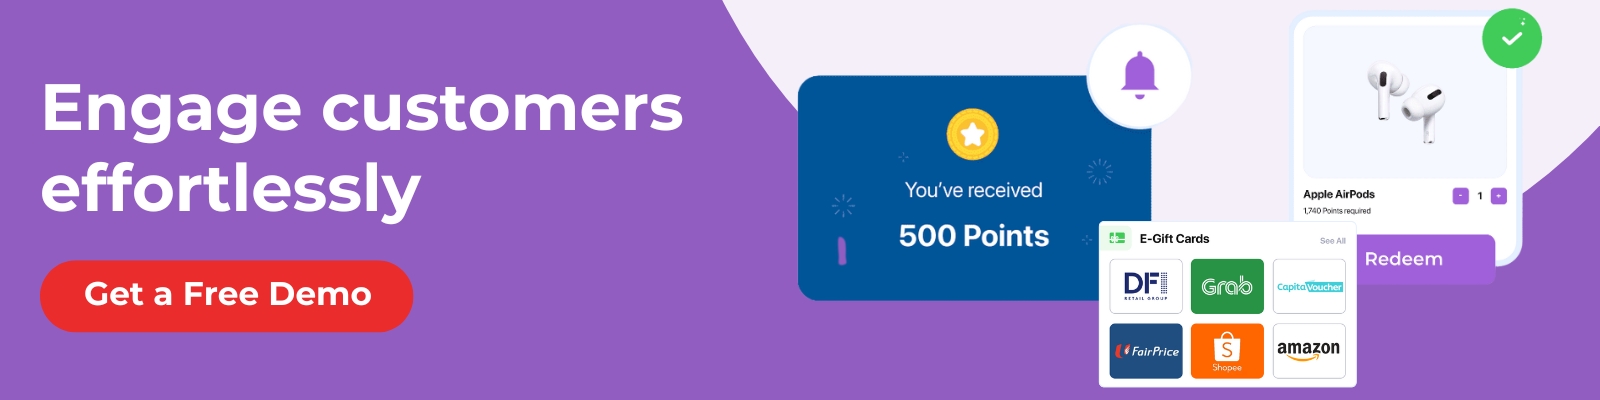
Measurement only works when your data connects. SPUR helps close that gap across the reward side of your engagement strategy.
Monitor campaign performance
Campaign and reporting tools give you visibility into results and spend, making it easier to see what’s working and adjust quickly.
Analyse reward redemption
Redemption data shows which rewards and campaigns drive customer participation, helping you refine your catalogue and remove friction.
Create personalised reward experiences
Segment audiences and tailor reward experiences based on customer behaviour, so each group receives something relevant.
Connect engagement with loyalty initiatives
SPUR doesn’t replace your analytics stack or measure every engagement metric. Instead, it strengthens one important part of the picture: the rewards and loyalty activity that turn engagement into measurable outcomes.
Ready to see how rewards can make customer engagement easier to grow and measure? Fill in the form below to speak with our team.